
A Data Scientist view on stocks
Analyze different data source on stocks

Introduction
Irrespective of any field, Data scientists(DS) love data(Don’t we?). DS also loves connecting different data endpoints and see if it makes sense. In this article, I will connect other data points on stocks, perform a detailed analysis, and create charts to understand better.
Note: Goto for non-technical users just goto the summary section

Why another analysis?
Why do we need it? Data about stocks are so much abundant. Each data source covers different angles of a stock. There is a lot of activity happening on the stock market every single day, hour, minute.
So what if we group all the data and use it for our analysis? What insights will it provide is what we are going to cover in this article.
Sourcing data
To get all this data, we need to connect individual APIs of all the services. Some data sources might need a key with an account. Some require you to create an app and perform an OAuth connection. Sourcing data is an article of its own. I will talk about it in another article.

Data loading and cleanup
We need to load all the data, load it in data frames and clean up the data. Once we clean up the data, we can perform various analyses.

As a first step, we need to load the data into data frames. We can parse through individual CSV files and write code. Below is another way to load the data.
We can loop through all the files and execute the code to create data frames.
Now we should have all the CSV data loaded into the data frames. Now, we need to parse and clean the data. The below function will clean up the data column name and put the columns in front.
Positive stocks
Now, we have a lot of data for our analysis. As a first step, let us find the common stocks across different positive data frames. You might think, what is positive? Positive comments, sentiments, insider buys, etc.

Now, we have all the positive stocks data frames. We will merge all these data frames and see if it makes sense.

Unfortunately, there is not a single stock which is common in all the areas. Now let us try in a different way, by combining different data frames using itertools.

If we combine yahoo finance active stocks and stockwits sentiment, we are getting back a list of stocks which may pop on that day or on previous day. It turned out to be true that, most the stocks poped. You can check the stats of the stocks around the dates of this article.
Negative stocks
If we go over the same process for negative stocks, we will get a list of common stocks. Below is the screenshot of the output.

Humans are not good at reading table data. Are we? We can easily consume visualizations. So now let us plot some charts. For this article, I am going to use Altair for the visualizations.
pip install altairSentiment
If we plot just the StockTwits sentiment, we will get a chart like the below one. We can see AMD is clearly one of the stocks which are on the watchlist of StockTwits.

Stocks on Yahoo Finance
We will combine the active large caps and small caps for yahoo finance and create a combined chart.

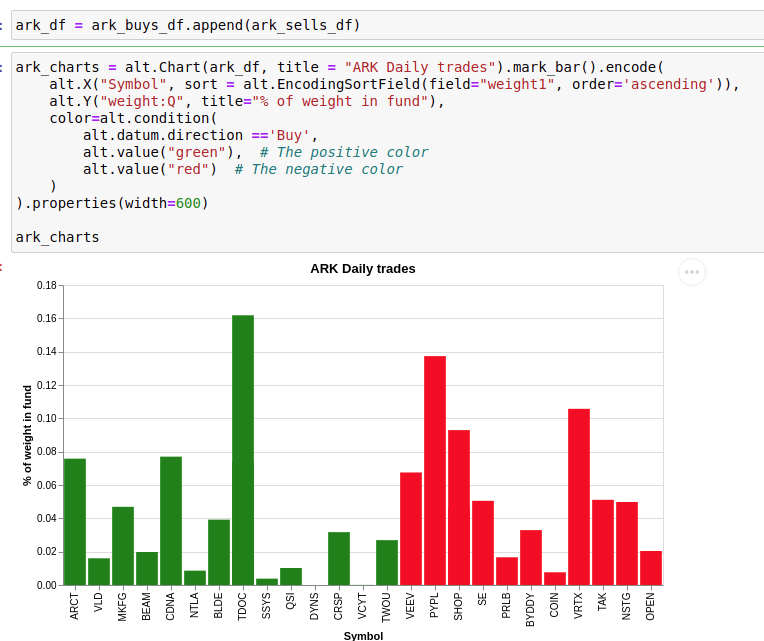
Ark Funds
I am a big fan of ark funds. Why not plot them as well?
Summary of charts
Likewise, we can plot all the other plots individually. Finally, we can combine all the plots and get a dashboard of all the charts.
Some charts are not plotted, such as IPO stocks, common positive and negative stocks. Those can be included as well.

Summary
It was an interesting analysis to combine different data sources of stocks and merge and find the golden ones for the day. We can also add more data sources to it and create more insights into the stock. To add
To receive an email on daily basis about stocks check-out here: shyambv.gumroad.com/l/portfoliobytes